Plots
Simple graph plotting
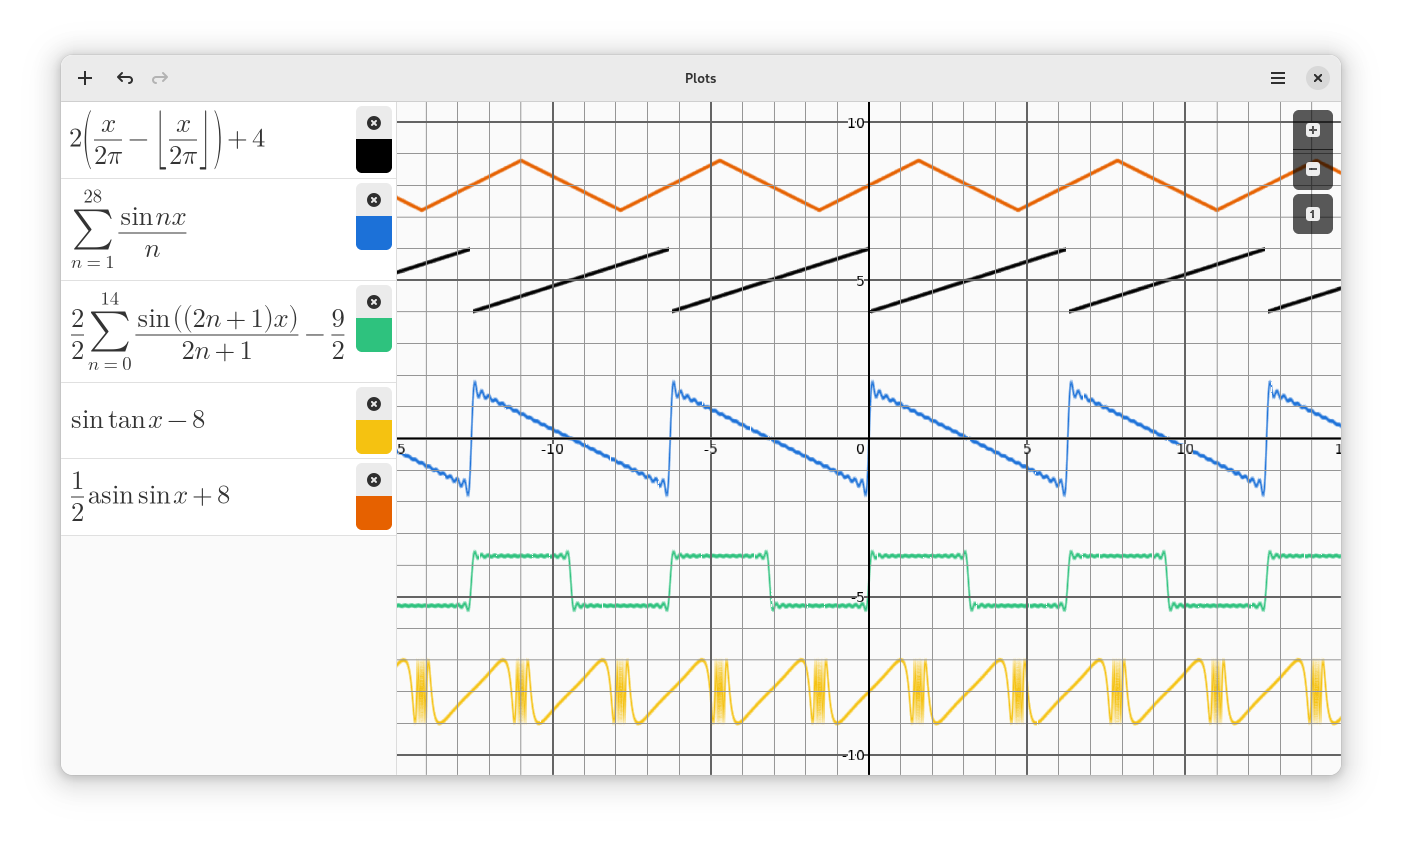
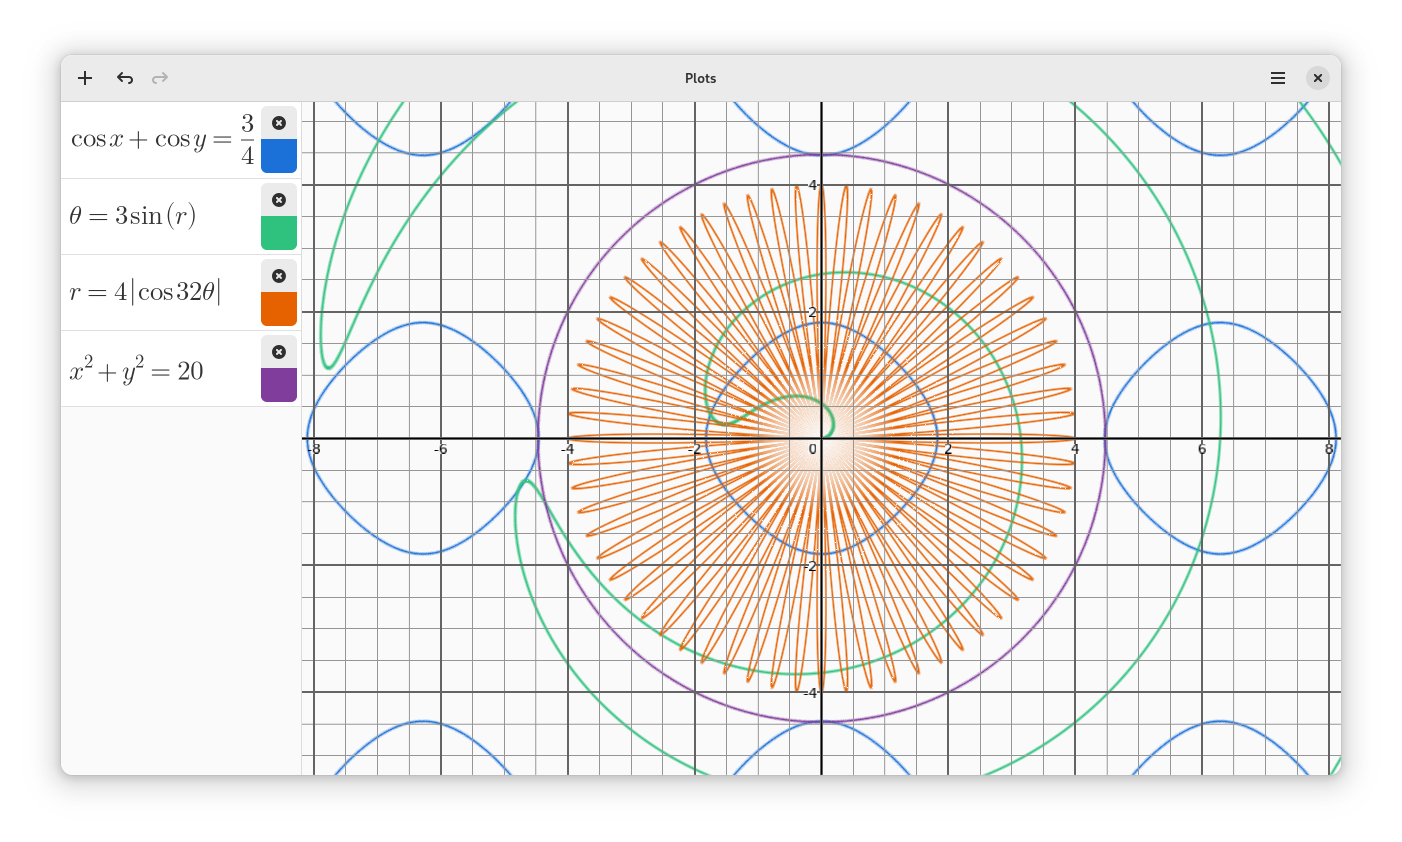
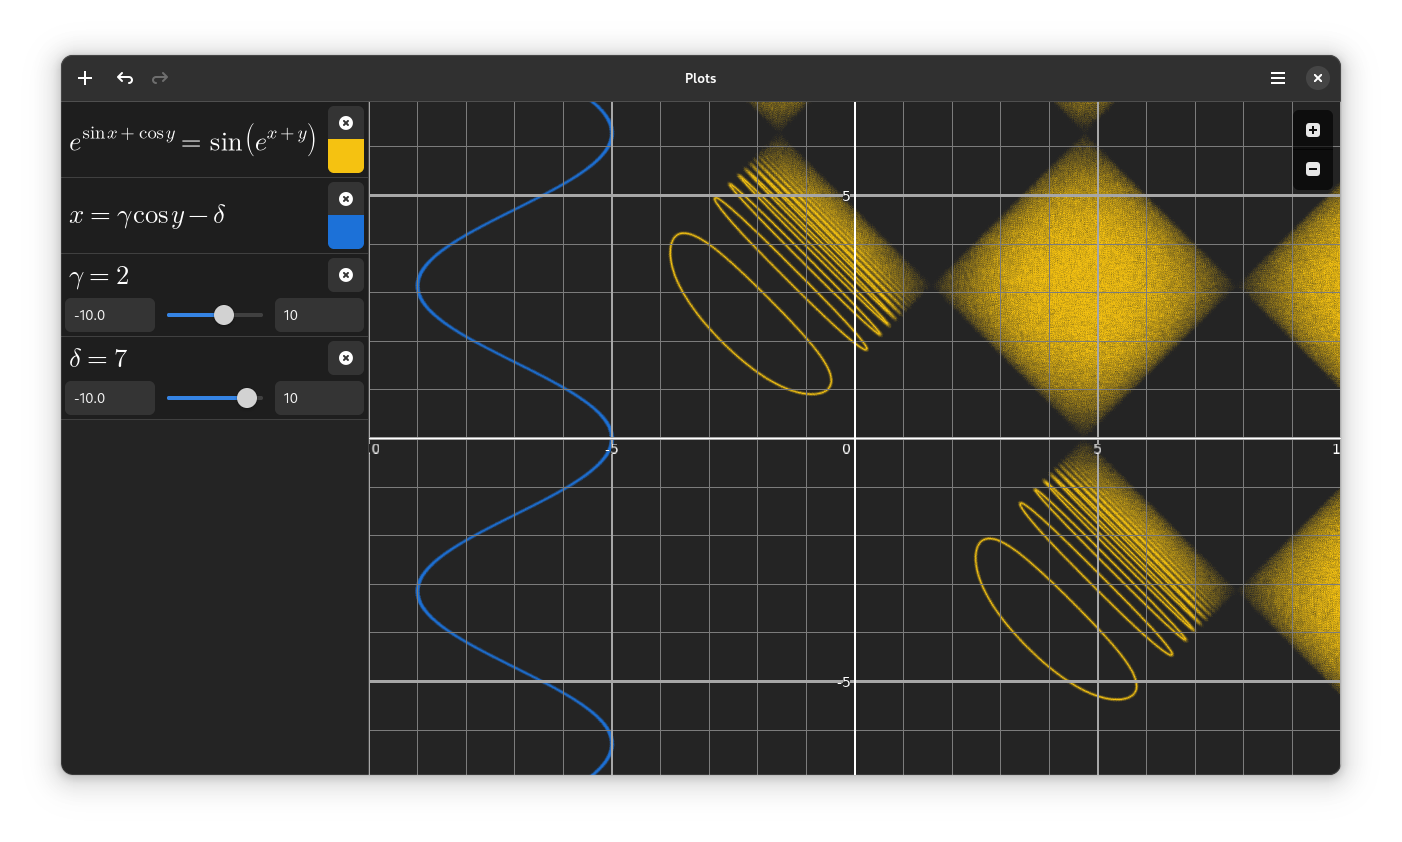
Plots makes it easy to visualise mathematical formulae. In addition to basic arithmetic operations, it supports trigonometric, hyperbolic, exponential and logarithmic functions, as well as arbitrary sums and products. It can display polar equations, and both implicit and explicit Cartesian equations.
Plots is designed to integrate well with the GNOME desktop and takes advantage of modern hardware using OpenGL.
גרפים תוכנן לשילוב מיטבי עם שולחן העבודה GNOME ומנצל חָמְרה מודרנית באמצעות OpenGL.
Tule mukaan
Selaa käyttöliittymää
Tutustu meihin


Lisätietoja
Keywords
- Education
- Linux
- Math
- Plots
- Science